Advanced research note ·
The Missing Denominator Test for Self-Storage Metrics
Require every rate, ratio, average, benchmark, or comparison to disclose its eligible population, exclusions, time, source, coverage, uncertainty, and authority.
A percentage can look precise while concealing the most important part of the claim.
“Conversion rose to 42 percent.” “Occupancy reached 91 percent.” “The automation handled 87 percent of requests.” Each statement invites a decision. None is ready to support one until the reader can reconstruct what entered the denominator, what stayed out, when the population existed, and which source held authority.
The denominator is not merely the number below the line. It is the operating population a metric claims to describe.
That population can change when a unit goes offline, a lead is duplicated, a move-in crosses midnight, an account leaves the active set, a work order is canceled, an AI case is never sampled, or one facility stops sending data. If those changes are hidden, the percentage may improve while the operation does not.
This is the missing denominator test: before using a rate, ratio, average, benchmark, or comparison, require enough evidence to reproduce the eligible population and its exclusions.
The method is designed for self-storage operators. It is an authored operating control, not a mandatory industry standard or a claim that one formula fits every portfolio.
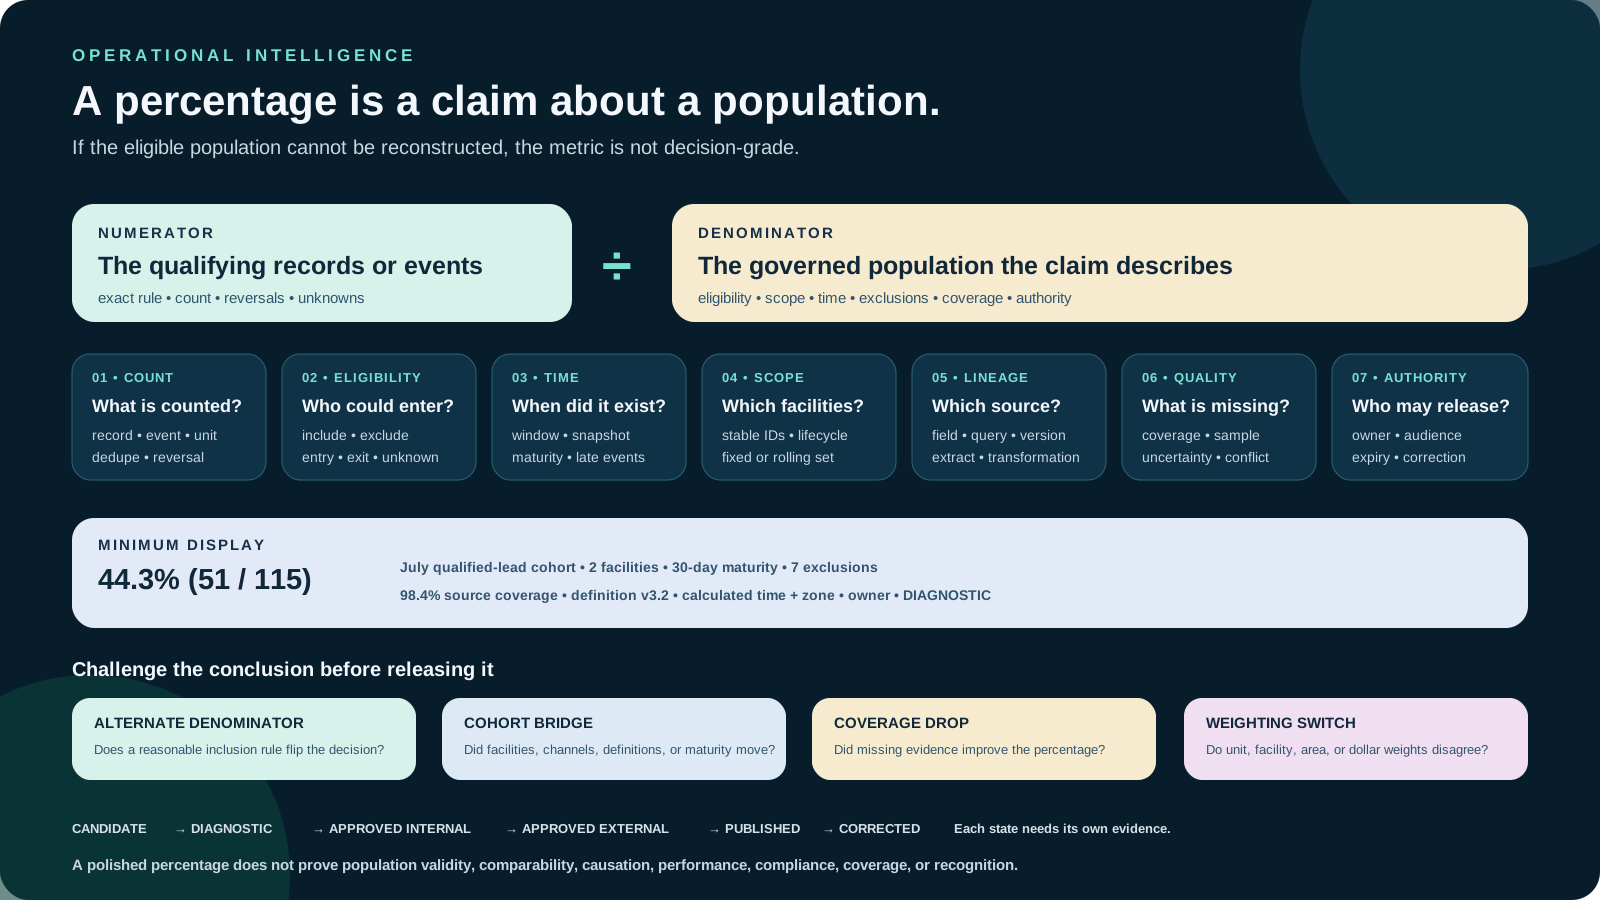
Open the full-size accessible diagram.
Governed companion package
Inspect the claim card, denominator register, and readiness gates.
These exact files contain an authored diagnostic and fictional metrics. They do not establish a company KPI, benchmark, product or model performance, causal result, accounting or legal conclusion, certification, external review, coverage, or recognition.
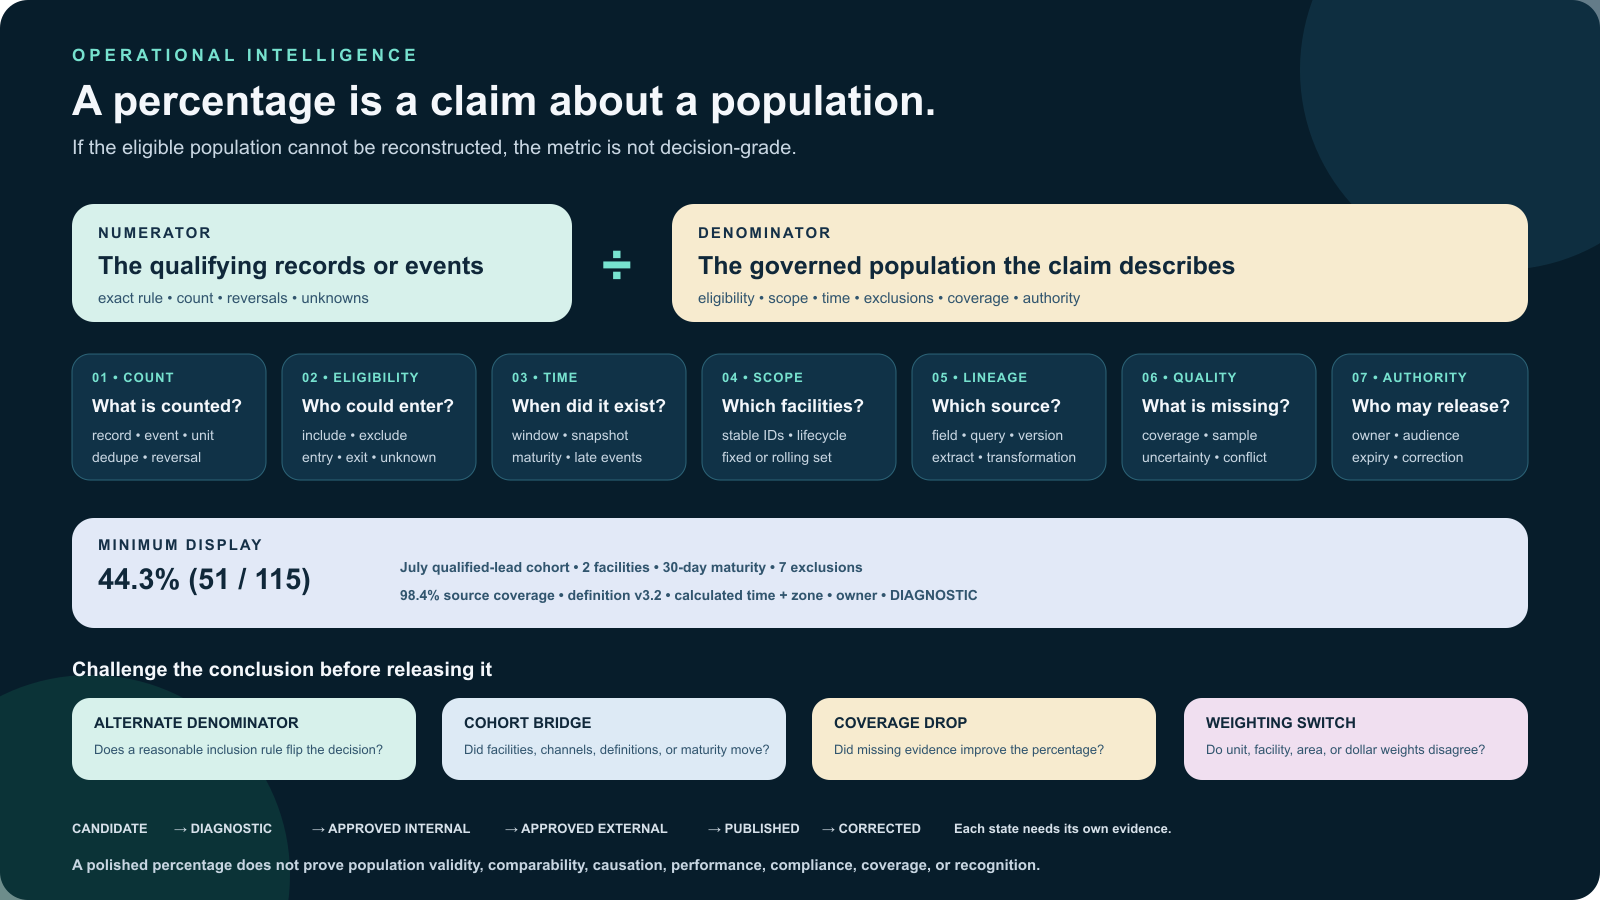
A metric is a governed statement, not a dashboard tile
The familiar expression is:
metric value = numerator ÷ denominator
An operationally useful expression is closer to:
metric value = function(numerator rule, denominator rule, facility set, cohort, time window, source state, exclusions, transformation, and uncertainty)
Two teams can calculate “occupancy” correctly and still calculate different things. One may use occupied units divided by all physical units. Another may use occupied rentable units divided by units available for rent. One may exclude company units, damaged units, or units under construction. Another may leave them in. The resulting percentages are not comparable merely because their labels match.
The U.S. Census Bureau's 2022 NAICS definition for 531130 identifies establishments primarily engaged in renting or leasing self-storage space and distinguishes the category from general warehousing and coin-operated lockers. That classification is useful for scope. It does not turn every self-storage facility into a valid peer for every metric. Climate control, unit mix, maturity, channel strategy, lifecycle, data system, and operating rules can still make populations materially different.
Run the seven-question test
A decision-grade metric should answer seven questions without relying on tribal knowledge.
1. What exactly is being counted?
Name the record type and the qualifying event. “Leads” is not enough. Does the numerator count signed leases, completed move-ins, paid reservations, or any record moved to a won stage? Are reversals removed? Can one person create several lead records?
2. What population was eligible?
State the denominator rule in executable language. A lead-conversion denominator might include unique inquiries received during the period that met a documented qualification rule. It might exclude spam, employee tests, exact duplicates, unsupported markets, and inquiries received after a cutoff. The rule should not change silently to improve the result.
3. When did membership begin and end?
Declare the observation window, cohort rule, cutoff, named time zone, and late-arrival policy. A same-month conversion rate asks a different question from a cohort rate that follows July inquiries for 30 days. Neither is inherently superior. They are not substitutes.
4. Which facility set does the claim cover?
Identify every included facility by stable identifier and version the set. “Portfolio” is not a stable population when facilities open, close, change systems, enter renovation, or fail to report. A comparison should show whether it uses all facilities, a fixed cohort, a same-store cohort, or only facilities with complete data.
5. Which source and query produced it?
Record the source system, record and field authority, extraction time, query or semantic-model version, transformations, and known conflicts. A dashboard cache is a locator, not necessarily the authoritative source. The GAO data-reliability guide frames reliability through accuracy, completeness, and applicability for the intended purpose. Its guidance is written for audits, but the discipline transfers: a field that is accurate for billing can still be inapplicable to a marketing cohort.
6. What is missing or uncertain?
Report excluded records, unknown states, missing facilities, late events, sample size, coverage, and material limitations. Do not silently treat unknown as false or missing as zero. The Census Bureau Statistical Quality Standards address coverage, nonresponse, comparisons, uncertainty, and reproducible documentation in federal statistics. A private operator is not bound by those standards, but they are a useful reminder that a number's quality depends on how the population was observed.
7. Who may approve the definition and release the claim?
Name the metric owner, source owner, reviewer, decision use, audience, expiry, and correction path. A data analyst may implement a definition without holding authority to change the operating policy it represents. An AI system may compute or explain a metric without having authority to approve its population or publish the result.
If any answer is missing, the metric should be labeled held, diagnostic only, or not comparable—not rounded into confidence.
Six self-storage metrics that fail differently
The test becomes practical when applied to familiar measures.
Physical occupancy
Possible numerator: occupied rentable units at an as-of time.
Possible denominator: rentable units available within the same facility snapshot.
Questions: Are offline, damaged, company-use, model, combined, overlocked, reserved, or under-construction units included? Does a move-out at 10:00 and move-in at 15:00 count once, twice, or only at the snapshot? Is the value unit-weighted or area-weighted?
The word “possible” matters. The owner must approve the definition appropriate to the decision.
Economic occupancy
This label is especially dangerous because teams may divide different revenue concepts by different potential-revenue concepts. Earned, billed, collected, discounted, waived, tax-inclusive, insurance-inclusive, and bad-debt-adjusted amounts are not interchangeable. The denominator requires an approved rate basis, time basis, unit eligibility rule, and treatment of concessions and offline inventory.
Do not compare economic occupancy until both sides disclose the same contract.
Lead conversion
A 40 percent conversion rate could mean 40 move-ins from 100 unique qualified inquiries. It could also mean 40 signed leases from 100 form submissions, including duplicates and spam, or 40 move-ins divided by the 100 leads still visible after records were deleted.
Show the cohort and counts: 40 / 100, not only 40%. Then show the qualification, deduplication, attribution, maturity, and reversal rules.
Delinquency
An account rate and a dollar rate answer different questions. The account denominator might be active accounts at a defined as-of time; the dollar denominator might be charges due under a defined ledger policy. Grace periods, disputed charges, partial payments, credits, write-offs, autopay retries, and move-out state can change either population.
A delinquency trend is not reproducible without the aging rule and snapshot time.
Work-order completion
“Ninety percent completed on time” requires a denominator of eligible work orders with a defined due-time rule. Were canceled, duplicate, reopened, waiting-on-vendor, safety-held, or no-access cases excluded? Was the clock paused? Did the denominator include only closed work, allowing an unresolved backlog to disappear?
Publish the open eligible backlog next to the completion rate when the decision depends on both.
AI-assisted handling
“The AI handled 85 percent” is not a performance measure until “handled” is defined. Did the system draft, classify, recommend, route, answer, execute, or close? Was the denominator all received cases, supported cases, cases passing a confidence threshold, or only cases sampled for review? Were human corrections counted?
The NIST AI RMF 1.0 describes context-sensitive measurement, documented test details, benchmarks, uncertainty, and evaluation in conditions similar to deployment. Its current Measure-function presentation also says metric appropriateness should be reassessed. Neither source defines a self-storage automation rate. The operator still has to expose the denominator, affected population, human baseline, review coverage, error classes, and consequences.
The denominator can move without the operation moving
Consider a fictional two-facility portfolio.
| Facility | Prior conversions | Prior qualified leads | Current conversions | Current qualified leads |
|---|---|---|---|---|
| Cedar Lock | 36 | 90 | 38 | 95 |
| Harbor Stack | 14 | 35 | 13 | 20 |
| Total | 50 | 125 | 51 | 115 |
The fictional portfolio conversion rate rises from 40.0 percent to about 44.3 percent. Conversions rose by one, while the denominator fell by ten. Harbor Stack's apparent rate rises sharply because its qualified-lead population contracts.
That may reflect a real improvement, a channel shift, stricter qualification, missing source records, or a broken intake. The percentage alone cannot decide which.
The correct response is not to reject the metric. It is to decompose the change:
- numerator change;
- denominator change;
- definition change;
- facility-set change;
- source-coverage change;
- cohort-maturity change;
- and unresolved unknowns.
A comparison needs a comparison contract
Before stating that one facility, period, channel, or model is “better,” record:
- metric definition and version;
- exact numerator and denominator counts;
- unit of analysis;
- facility-set version;
- observation window and named time zone;
- cohort entry, exit, maturity, and late-event rules;
- inclusions and exclusions;
- source and query versions;
- completeness and unknown-state counts;
- weighting and aggregation method;
- uncertainty or sensitivity analysis;
- comparator identity and comparability decision;
- owner, reviewer, release state, and expiry.
This contract also matters for building metrics. The Department of Energy's building re-tuning guidance explains energy use intensity as energy consumption normalized by building square footage and notes that weather, climate, activity, and construction affect the measure. Even a familiar denominator such as square footage requires a defined area, period, source, and comparison context.
At the expert level, test whether a conclusion survives reasonable alternate denominators. Recalculate with and without disputed exclusions. Separate fixed-cohort from rolling-population results. Show both facility-weighted and unit-weighted portfolio values when they answer different questions. If the conclusion flips, report the sensitivity instead of choosing the friendliest view.
The NIST Technical Note 1297 concerns NIST measurement results, not self-storage dashboards. Its core discipline is still instructive: define what is being measured, identify uncertainty components, and report uncertainty rather than pretending a measured value is exact. Applying that discipline here is an analogy, not a claim of formal metrological conformity.
A minimum display standard
A decision-facing metric should display more than one large number. A compact standard is:
44.3% (51 / 115) · July qualified-lead cohort · 2 facilities · 30-day maturity · 7 duplicate/spam records excluded · source coverage 98.4% · definition v3.2 · calculated 2026-08-22 14:00 America/Denver · owner: Revenue Operations · status: diagnostic
That line is fictional, but its structure is useful. It lets a reviewer challenge the population without reverse-engineering the dashboard.
For executive rollups, keep the compact display and link it to a metric claim card containing the full contract. For customer-facing, investor-facing, or public claims, add the audience permission, substantiation, review, and correction controls appropriate to that release. Internal approval does not establish external eligibility.
What AI can and cannot do
AI can help:
- inventory candidate definitions across reports;
- identify missing denominator fields;
- compare query versions;
- flag facility-set drift;
- generate alternate-denominator sensitivity runs;
- trace claim text to a metric contract;
- and draft a limitation note for human review.
AI should not:
- invent an eligible population;
- treat missing as zero;
- choose exclusions that make a result look better;
- infer source authority from field names;
- declare cohorts comparable because labels match;
- approve its own benchmark;
- suppress uncertainty or conflicting results;
- or publish a metric without the exact authorized release gate.
The model's confidence is not the metric's coverage, and fluent explanation is not evidence that the denominator is correct.
The operator exercise
Choose six metrics currently used in meetings: one inventory metric, one revenue or delinquency metric, one demand metric, one facility-work metric, one customer-communication metric, and one AI or automation metric.
For each metric:
- Write the exact decision it supports.
- Record the displayed value and reconstruct numerator and denominator counts.
- Define the eligible population without using the metric's label.
- List every exclusion, unknown, missing facility, and late event.
- Identify source, field, query, facility-set, and definition versions.
- Recalculate using one reasonable alternate denominator.
- Mark whether the conclusion survives.
- Assign an owner, reviewer, release state, expiry, and correction path.
Use the companion metric claim card, denominator control register, readiness suite, and visual test. Hold any claim whose denominator cannot be reproduced.
The release question
Before a metric drives a decision, the owner should be able to say:
I can identify the population this number describes, reproduce who entered and left it, explain the time and facility scope, show the source and transformation, disclose what is missing or uncertain, and name who approved this definition for this decision.
If that sentence is not supported, the metric is not decision-grade yet.
Sources
The companion source register records source owner, publication or version date, retrieval date, durable locator, claim supported, limitation, and provenance note.
- Artificial Intelligence Risk Management Framework 1.0, NIST, January 26, 2023; current page checked August 22, 2026 and notes that the framework is under revision.
- AI RMF Core: Measure, NIST AI Resource Center, mutable presentation of AI RMF 1.0 checked August 22, 2026.
- Assessing Data Reliability, GAO-20-283G, U.S. Government Accountability Office, December 16, 2019.
- Statistical Quality Standards, U.S. Census Bureau, February 21, 2023.
- NIST Technical Note 1297, 1994 edition; current page updated May 6, 2026.
- Screening a Building for Re-tuning Potential, U.S. Department of Energy, current page checked August 22, 2026.
- 2022 NAICS definition 531130: Lessors of Miniwarehouses and Self-Storage Units, U.S. Census Bureau, 2022 edition; page revised June 11, 2026.